All articles

Statistics

Cp, Cpk, Pp and Ppk explained with worked examples

Four capability indices, one process, and four very different conversations with your customer. What each index actually measures, when it lies to you, and how to read the output properly.

Dr. Jvalin Sonawala 26 August 2026 10 min read
Ci Flow Knowledge Hub deep statistics guide with capability interpretation

Capability in one sentence

Process capability compares the voice of the process, meaning how much your output actually varies, with the voice of the customer, expressed as specification limits. If the spread of your process comfortably fits inside the specification window and sits centred within it, you are capable. If it does not, you will produce defects no matter how hard your operators try, because the defects are a property of the process, not of the people running it.

Everything else in capability analysis is bookkeeping about two questions: which variation are we using, and are we allowing for the process being off-centre?

Cp versus Cpk: spread versus position

Cp is the ratio of the specification width to the process spread: Cp = (USL − LSL) / 6σ, where σ is estimated from within-subgroup variation. It answers a single question. Could this process fit inside the specification if it were perfectly centred? It says nothing at all about whether it is centred.

Cpk adds position. It takes the worse of the two one-sided distances: Cpk = min[(USL − mean)/3σ, (mean − LSL)/3σ]. When the process is perfectly centred, Cp and Cpk are equal. As the mean drifts toward one limit, Cpk falls while Cp stays exactly where it was.

A worked example makes the trap obvious. Suppose a fill weight has LSL = 495 g, USL = 505 g, mean = 503 g and within-subgroup σ = 0.8 g. Cp = 10 / 4.8 = 2.08, which looks world-class. Cpk = min[(505 − 503)/2.4, (503 − 495)/2.4] = min[0.83, 3.33] = 0.83, which is not remotely acceptable. The process has excellent precision and a centring problem worth roughly 1 per cent scrap. Report only Cp and you mislead your customer; report only Cpk and you lose the insight that the fix is a setting adjustment rather than a variation-reduction project.

  • Cp high, Cpk low → centring problem; adjust the process mean
  • Cp low, Cpk low → variation problem; reduce common-cause spread
  • Cp ≈ Cpk → process is centred; the index you quote matters less
  • Cpk ≥ 1.33 is the common minimum expectation; ≥ 1.67 for safety-critical characteristics

Pp and Ppk: the honest long-term view

Cp and Cpk use short-term, within-subgroup variation. Pp and Ppk use the overall standard deviation of all the data, which includes drift between subgroups, shift-to-shift differences, tool wear and material-lot changes. The formulas are identical; only the sigma changes.

The gap between Cpk and Ppk is therefore a measurement of your process control, not of your process precision. A large gap means the process is capable when nothing moves and not capable in real operating conditions, which is exactly the situation a customer experiences. This is the origin of the familiar 1.5 sigma shift used in Six Sigma metrics: it is an empirical allowance for long-term drift.

Practical rule: quote Ppk to customers and quote the Cpk/Ppk pair internally. If Cpk is 1.8 and Ppk is 0.9, your improvement project is about stability and control, not about machine capability, and no amount of tightening tolerances will help.

The three assumptions people skip

First, stability. Capability indices are meaningless on an out-of-control process, because the mean and sigma you are reporting are not properties of anything stable. Always run a control chart before a capability study. If special causes are present, fix them first; the capability number will change anyway.

Second, normality. The standard indices assume an approximately normal distribution. If your data is skewed, and cycle times, waiting times and impurity levels usually are, a naïve Cpk can be badly wrong. Test normality, and if it fails, use a transformation or a non-normal capability method rather than pretending.

Third, measurement error. Your observed variation is the sum of process variation and measurement-system variation. If a Gage R&R study shows 30 per cent of your variation is the measurement system, your capability study is partly measuring your gauge. Run MSA before capability, always, without exception.

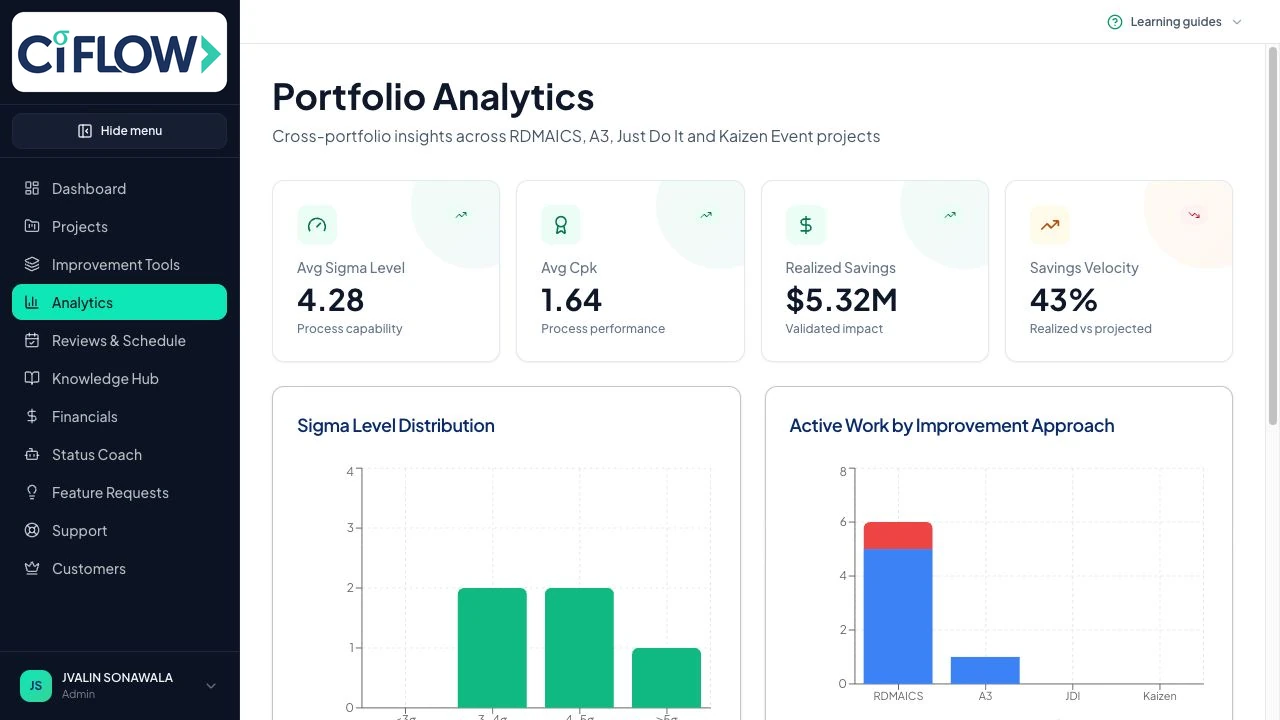
Ci Flow analytics dashboard showing sigma level and capability performance across projects
Portfolio analytics track average sigma level and Cpk across every active project.

Reading the output like a practitioner

When you run a capability study in Ci Flow you get the indices, the fitted distribution against the specification limits, the estimated defect rates per million and the sigma level implied by the result. The sequence to read them in matters: distribution shape first, stability second, centring third, spread fourth, indices last. The indices are a summary of what the chart already told you.

Then translate into business language. 'Ppk 0.78' means nothing to a plant director. 'At current performance we will ship roughly 9,700 out-of-specification units per million, and two thirds of that is because the process runs 2 grams high' produces an immediate decision. The statistics are the evidence; the sentence is the deliverable.

process capabilityCp Cpk differencePp PpkSix Sigma capability analysisprocess capability calculator

Run this method inside Ci Flow

RDMAICS, A3, Just Do It and Kaizen projects with the full Lean Six Sigma toolset, AI interpretation and tollgate presentations built from your real evidence.

Keep reading

Ci Flow

Ci Flow connects improvement methodologies, guided tools, project evidence, AI support, collaboration and tollgate presentations in one operational-excellence workspace.

RDMAICS · A3 · Just Do It · Kaizen

© 2026 Ci Flow. All rights reserved.

Built for evidence-led continuous improvement