All articles

Statistics

Gage R&R: how to run a measurement system analysis that holds up

If your measurement system consumes a third of your process variation, every chart, capability index and hypothesis test downstream is partly fiction. A practical guide to designing, running and interpreting Gage R&R.

Dr. Jvalin Sonawala 19 August 2026 9 min read
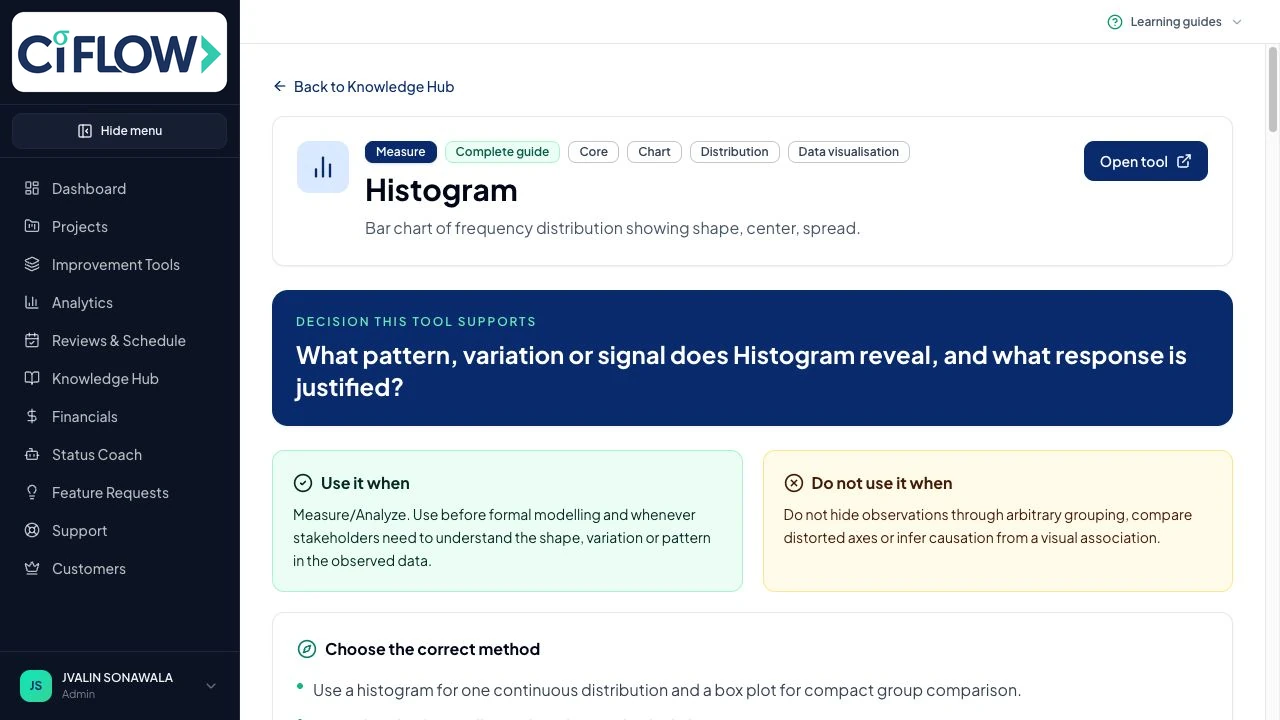
Ci Flow Knowledge Hub guide explaining measurement system analysis

Why MSA comes before everything

Every number in a Six Sigma project arrives through a measurement system: a gauge, an instrument, a report, a form, a human judgement. Total observed variation is process variation plus measurement variation. If the measurement system contributes heavily, you will chase phantom special causes, reject good product, accept bad product and generate hypothesis tests whose noise swamps the effect you are trying to detect.

This is why Measure phase discipline puts MSA before baseline data collection, not after. Collecting six weeks of data through an unvalidated measurement system is the most expensive mistake available to a project team, because it is invisible until somebody challenges the result in a tollgate.

What Gage R&R actually decomposes

A crossed Gage R&R study separates total variation into three buckets. Repeatability is equipment variation: the same appraiser measuring the same part again gets a slightly different answer. Reproducibility is appraiser variation: different people measuring the same part disagree. Part-to-part variation is the real signal you want your gauge to be able to see.

The classic design is ten parts, three appraisers, three repeat measurements, which is 90 readings. The parts must span the real range of the process, including near-specification items; if you sample ten nearly identical parts, part-to-part variation is artificially small and your percentage study variation will look terrible even with a good gauge. The order must be randomised and the appraisers must not see previous readings, or you are measuring memory, not repeatability.

  • 10 parts × 3 appraisers × 3 trials is the standard crossed design
  • Parts must represent the true process spread, not a convenient batch
  • Randomise order and blind the appraisers to earlier readings
  • Report both percentage study variation and the number of distinct categories

Interpreting the numbers

The headline metric is percentage study variation: the measurement-system standard deviation as a percentage of total study standard deviation. Under 10 per cent is acceptable. Ten to 30 per cent is marginal and may be acceptable depending on cost, criticality and the size of the effect you need to detect. Above 30 per cent the system is not fit for purpose and must be improved before the project continues.

Read the breakdown, not just the headline. High repeatability variation with low reproducibility variation points to the equipment: worn fixtures, poor resolution, unstable clamping, inadequate discrimination. The reverse points to people and method: ambiguous operational definitions, missing standard work, inconsistent training. The two causes have completely different remedies, and the split tells you which one you have.

Also check the number of distinct categories. Fewer than five means the system cannot reliably distinguish parts within your process spread, which makes control charting almost pointless. Two categories means your gauge can only tell you 'big' and 'small'.

Attribute systems need a different study

When the measurement is a judgement, such as pass or fail, cosmetic grade, claim accepted or rejected, or document compliant or non-compliant, a variable Gage R&R does not apply. You need an attribute agreement analysis: multiple appraisers, multiple trials, and a known correct answer for each item.

Report three things: within-appraiser agreement (is each person self-consistent?), between-appraiser agreement (do people agree with each other?), and agreement with the standard (are they all right?). It is entirely possible to have excellent between-appraiser agreement and be consistently wrong, which is the most dangerous state because the system looks stable.

In transactional and service processes this study is usually more valuable than any variable MSA, because most of the measurement error lives in inconsistent human classification rather than in instruments.

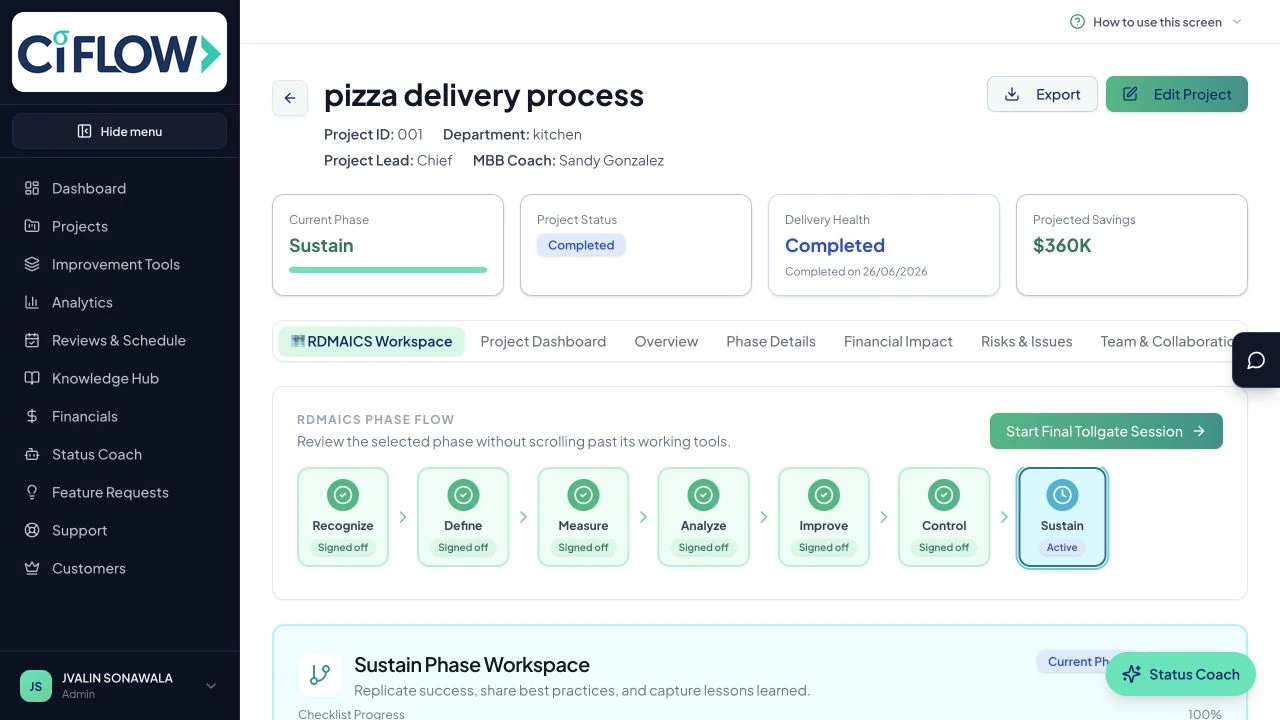
Ci Flow Measure phase workspace with measurement system analysis tools
MSA sits in the Measure phase toolset, ahead of baseline data collection.

Making MSA stick

An MSA is not a one-off project artefact; it is a maintenance routine. Set a re-study frequency for critical characteristics, tie it to calibration schedules, and re-run the study after any change to fixture, gauge, method or appraiser population. Attach the operational definition to the study, because the definition is the largest single driver of reproducibility in transactional processes.

Finally, keep the study with the project evidence rather than in somebody's spreadsheet. When a tollgate reviewer asks how you know the baseline is real, the answer should be a saved study with its variance components and date, not a recollection that 'we checked the gauge'.

Gage R&Rmeasurement system analysisMSA Six Sigmarepeatability reproducibilitypercent study variation

Run this method inside Ci Flow

RDMAICS, A3, Just Do It and Kaizen projects with the full Lean Six Sigma toolset, AI interpretation and tollgate presentations built from your real evidence.

Keep reading

Ci Flow

Ci Flow connects improvement methodologies, guided tools, project evidence, AI support, collaboration and tollgate presentations in one operational-excellence workspace.

RDMAICS · A3 · Just Do It · Kaizen

© 2026 Ci Flow. All rights reserved.

Built for evidence-led continuous improvement