
All articles

Methodology

One A3, seven stages: a worked example you can follow

Most A3s fail in the same two places: the current condition is an opinion, and the countermeasures arrive before the causes are verified. This is one A3 worked stage by stage on a fictional operation, with the numbers shown.

Dr. Jvalin Sonawala 23 September 2026 8 min read
The seven A3 stages in Ci Flow with six complete and the seventh in progress

Why A3 still beats a deck

An A3 is one page. That constraint is the whole method. A slide deck lets you carry an unproven claim for forty slides because there is always room for one more. One page does not, so the weak link shows itself early, which is exactly the point.

The discipline runs in seven stages: Background, Current Condition, Target Condition, Root Cause, Countermeasures, Implementation, Follow-up. It is PDCA with the thinking made visible. Plan covers the first five, Do is Implementation, Check and Act are Follow-up.

Two failures account for most weak A3s. The current condition is written as an opinion rather than a measurement, so nobody can tell whether the problem moved. And countermeasures are chosen before the causes are verified, so the team implements confidently against a guess. Both are visible in the worked example below, because the tool makes you write the evidence next to the claim.

The project we will follow

Everything from here uses a fictional operation with invented numbers: Northside Pizza Co., eleven stores, losing its 30 minute delivery promise on Friday nights. It is a deliberately simple case so the method stays visible. Nothing in it refers to a real business.

Before opening an A3 at all, check that A3 is the right vehicle. If the cause is already known and the fix is obvious and low risk, that is a Just Do It. If the problem needs a measurement system study, capability analysis and designed experiments, that is a full RDMAICS project. A3 sits between them: an important operational problem, a cause that is genuinely unknown, and a decision that needs several people to agree. Late Friday deliveries qualify.

  • Known cause, obvious fix, low risk, use Just Do It
  • Unknown cause, needs alignment across functions, two to eight weeks, use A3
  • Statistically complex, high value, needs designed experiments, use RDMAICS

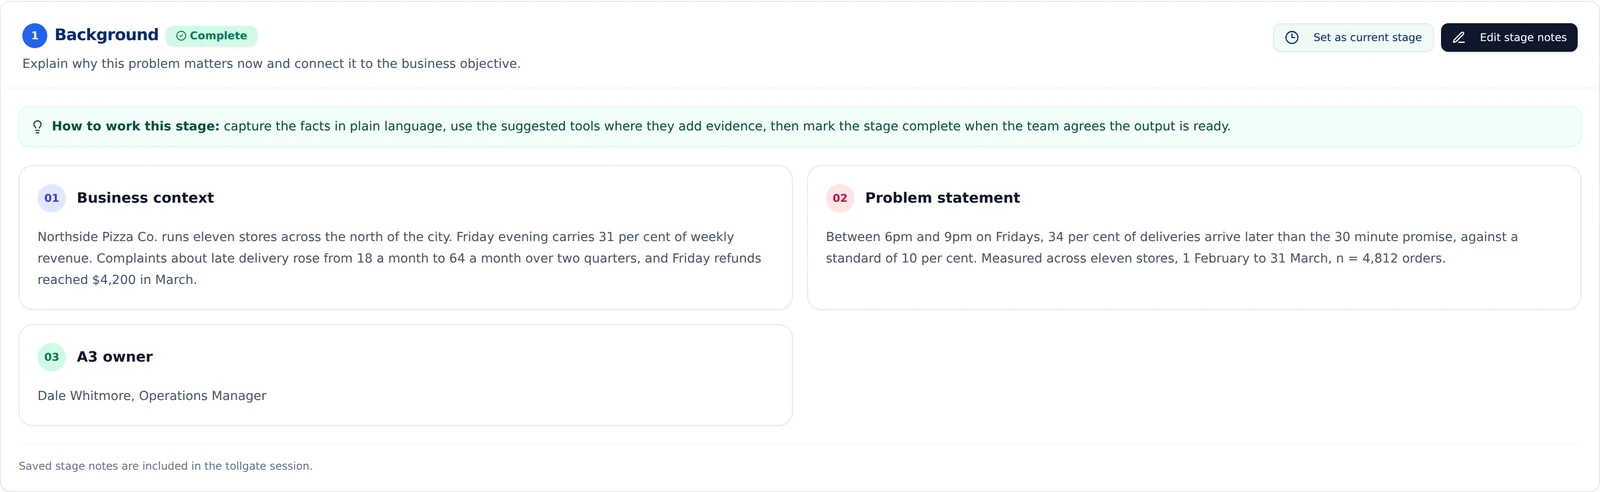
Stage 1. Background. Why this, why now

Background answers one question: why is this worth anyone's attention this quarter? It is not the place for causes or solutions.

The trap is writing a problem statement that contains a solution. "We need a second oven on Fridays" is a proposal wearing a problem's clothes, and once it is written down the rest of the A3 becomes a search for evidence that supports it. The statement here names a measurable gap and stops: 34 per cent of Friday evening deliveries arrive late against a standard of 10 per cent, measured across eleven stores over two months, n = 4,812.

Naming the owner matters more than it looks. An A3 with no name against it is a document. An A3 with a name against it is a commitment.

The A3 Background stage with business context, problem statement and owner
Stage 1. A measurable gap with a period, a scope and a sample size, and no solution hidden inside it.

Stage 2. Current Condition. Facts, not recollection

This is where most A3s quietly fail. The current condition has to be what the process actually does, observed, not what the process is supposed to do according to the procedure.

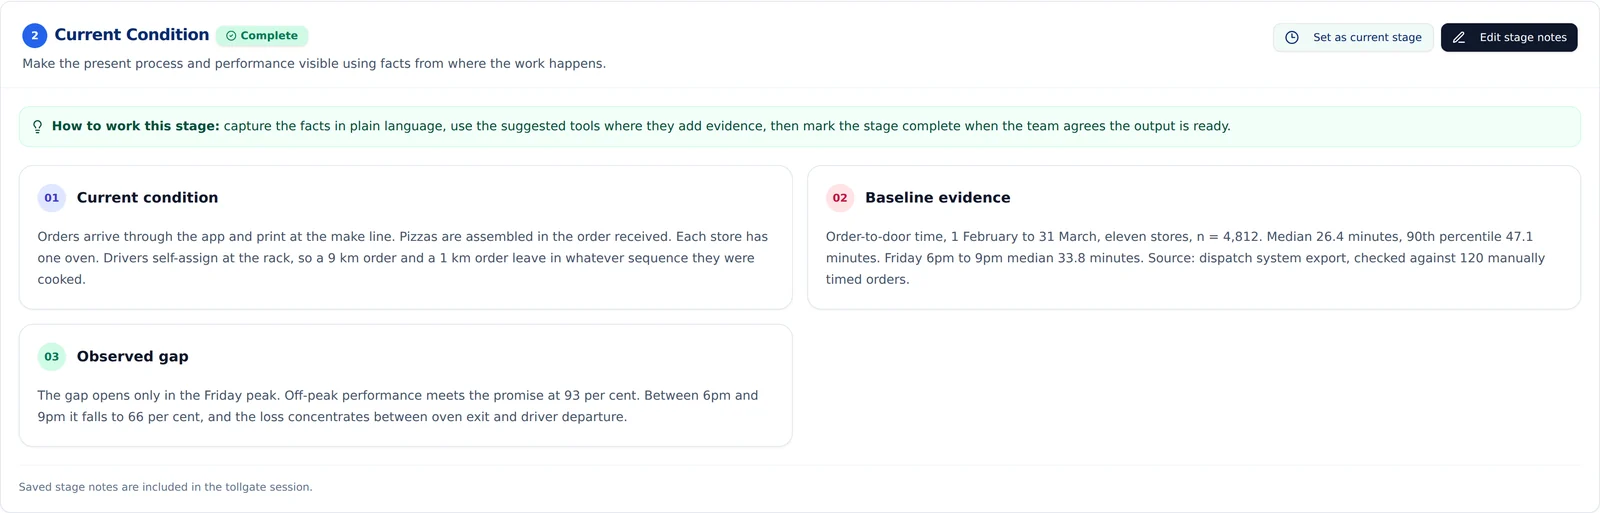
Three things make a current condition usable. A described process, written plainly enough that someone outside the team can follow it. A baseline with a metric, a period, a source and a sample size. And an observed gap that says where and when performance falls short rather than simply that it does.

In the example, the baseline is not a single average. It carries a median of 26.4 minutes and a 90th percentile of 47.1, and it separates the Friday peak from the rest of the week. That separation is what later shows the problem is not a capacity problem at all. An average alone would have hidden it.

The A3 Current Condition stage with the process described, the baseline and the observed gap
Stage 2. The baseline names the metric, the period, the source and the sample size, and keeps the peak separate from the rest of the week.

Stage 3. Target Condition. A number and a date

The target condition is one sentence with three parts: from what, to what, by when. "Improve Friday delivery performance" is not a target condition. "Move Friday 6pm to 9pm on-time delivery from 66 per cent to 90 per cent by 31 August, without adding driver headcount" is.

The constraint at the end does real work. Without it the team can hit the target by spending money, and the A3 becomes an approval request rather than a problem-solving exercise. Naming what you will not do is part of defining the target.

Stage 4. Root Cause. Every cause carries its evidence

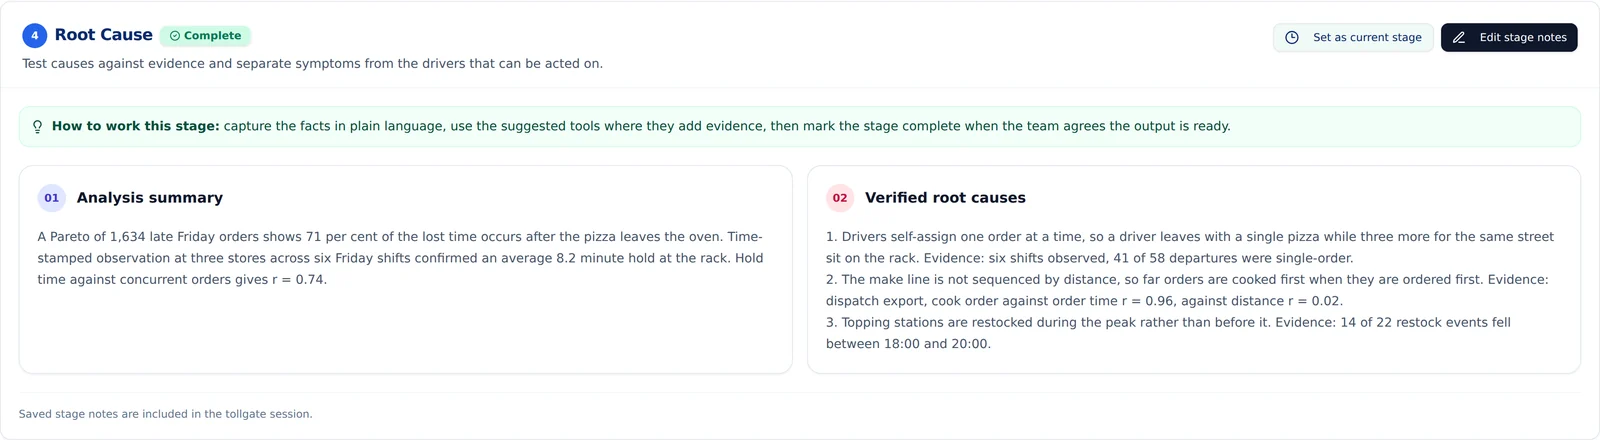
The stage asks for two things: what the analysis found, and which causes have been verified. The second word is the one that matters. A cause is verified when there is evidence attached to it that could have disproved it.

Three causes were verified in the example, and each carries its own evidence line. Drivers self-assign one order at a time, evidenced by 41 of 58 observed departures being single-order. The make line is not sequenced by distance, evidenced by a correlation of cook order to order time of 0.96 against 0.02 for distance. Topping stations are restocked during the peak, evidenced by 14 of 22 restock events falling between 6pm and 8pm.

Notice what the analysis ruled out. A Pareto of 1,634 late orders put 71 per cent of the lost time after the pizza left the oven. The kitchen was never the constraint, which is the opposite of what the team expected.

The A3 Root Cause stage with the analysis summary and three verified causes each carrying evidence
Stage 4. Three causes, three evidence lines. A cause with no evidence beside it is a hypothesis.

The tools hang off the stage, not the page

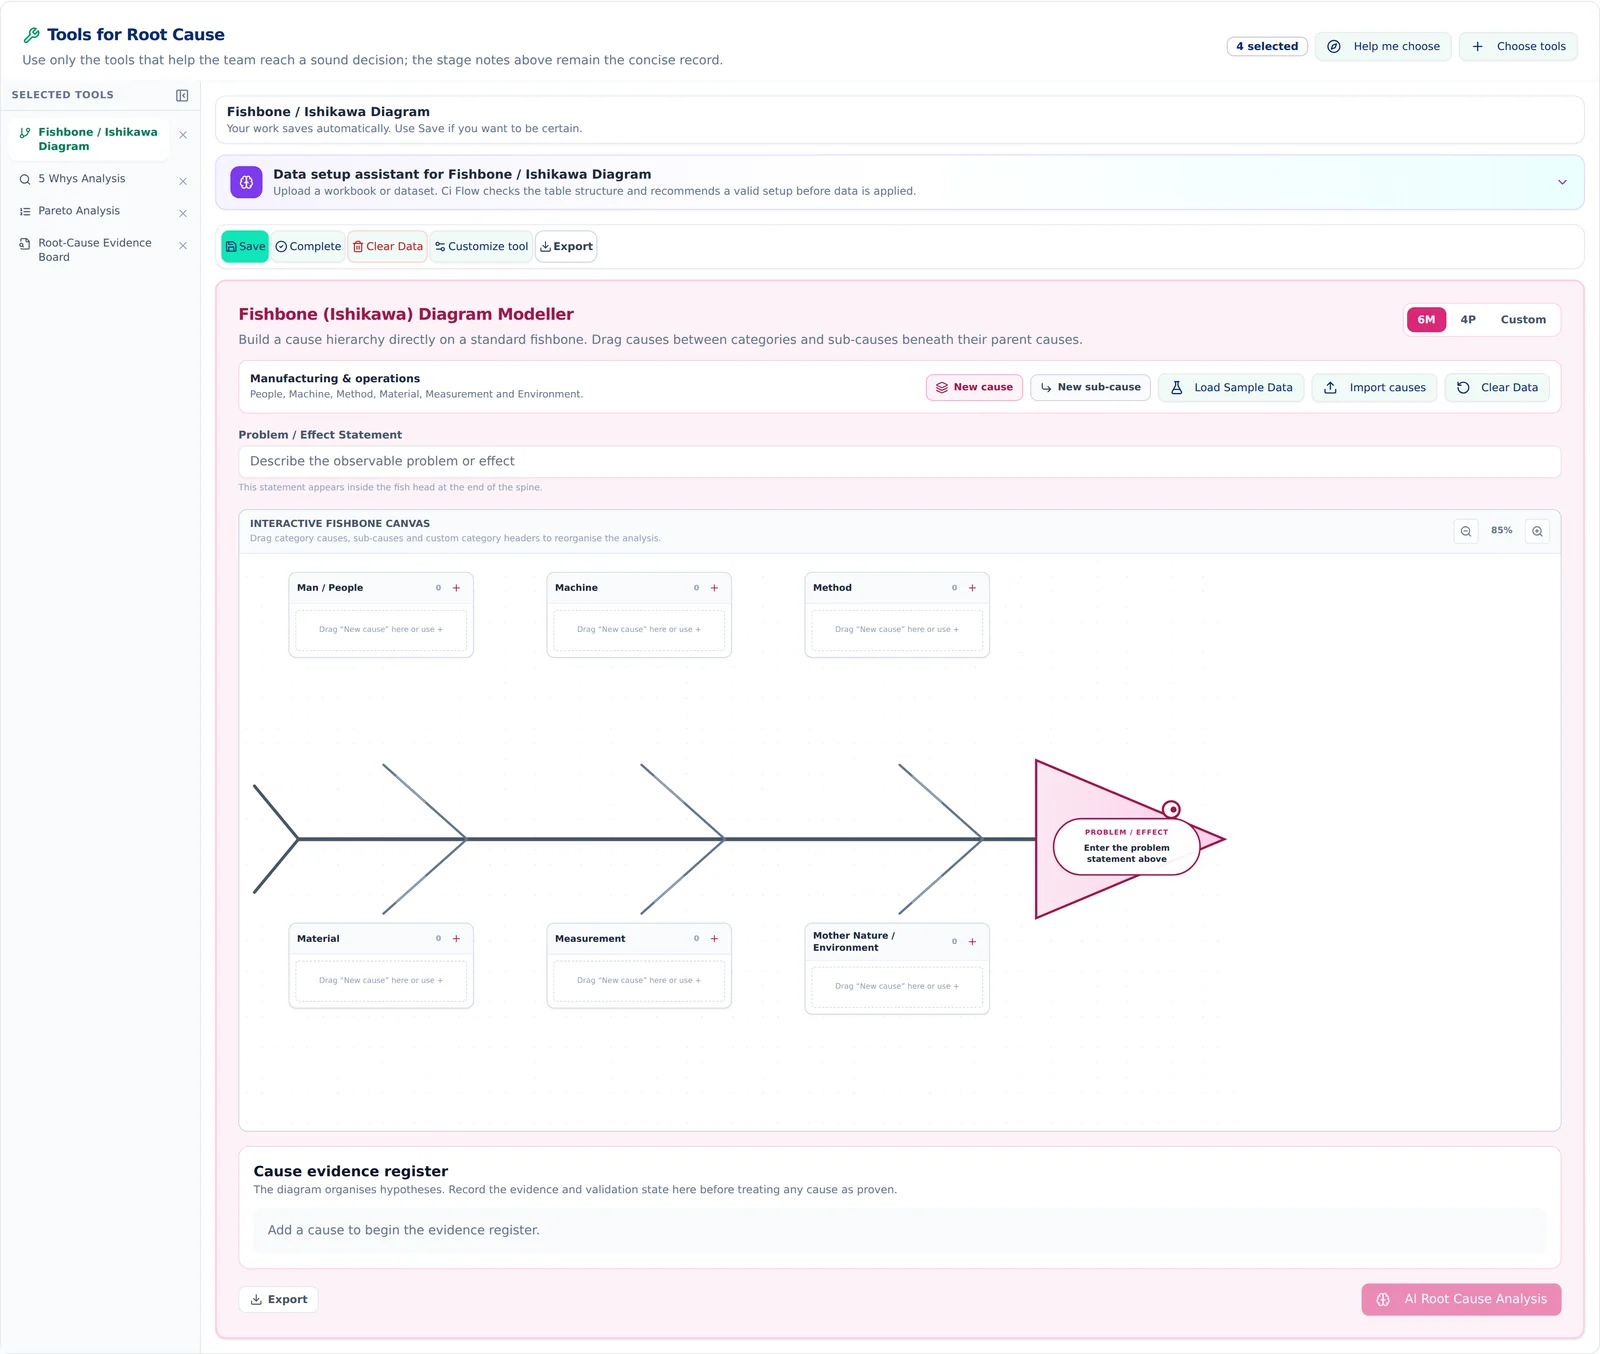
An A3 is one page, but the work behind it is not. The Fishbone, the 5 Whys, the Pareto and the evidence board all live attached to the Root Cause stage, where they can be worked on properly, while the A3 itself stays a summary.

That separation is what keeps an A3 readable. The page carries the conclusion and the evidence reference. The tool carries the working. A reviewer who doubts the conclusion can open the working; a reviewer who does not can read the page in four minutes.

The tool panel attached to the Root Cause stage showing Fishbone, 5 Whys, Pareto and the evidence board
The analysis tools sit under the stage that needs them, so the A3 page stays a summary rather than a folder.

Stage 5. Countermeasures. Say what you rejected

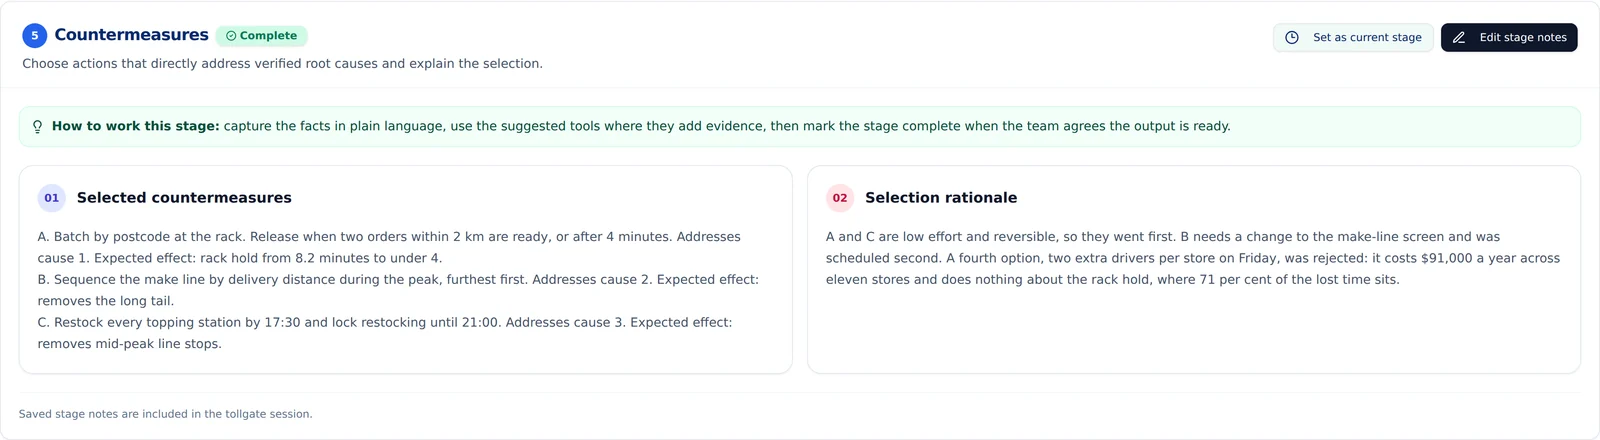
Countermeasures are written as a chain: action, the root cause it addresses, and the expected effect. If an action cannot name the cause it addresses, it does not belong on the A3.

The rationale field is the one people skip and the one reviewers read first. In the example it records that adding two drivers per store was considered and rejected, because it costs $91,000 a year and does nothing about the rack hold where 71 per cent of the lost time sits. That single sentence is worth more at a review than any of the selected actions, because it shows the obvious answer was tested and found wanting.

The sequencing is also deliberate. Two low-effort reversible changes went first; the one needing a system change went second. An A3 that schedules its hardest countermeasure first usually stalls there.

The A3 Countermeasures stage with three actions linked to causes and the selection rationale
Stage 5. Each action names the cause it addresses, and the rationale records the option that was rejected and why.

Stage 6. Implementation. Owners, dates, and a real test

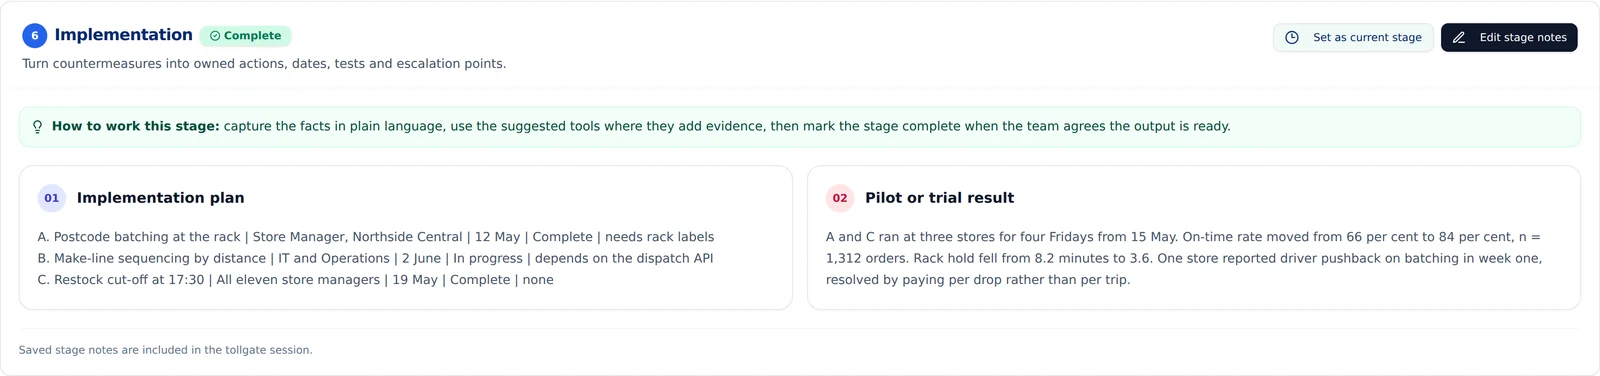
Implementation turns countermeasures into owned actions with dates, statuses and dependencies. It also holds the pilot result, and the pilot is where an A3 earns its credibility.

The pilot in the example ran at three stores for four Fridays and moved on-time performance from 66 per cent to 84 per cent on 1,312 orders. It also recorded something that went wrong: drivers pushed back on batching in week one, resolved by paying per drop rather than per trip. Recording the friction is not an admission of failure. An implementation section with no friction in it usually means nothing was tested hard enough.

The A3 Implementation stage with the action plan and the pilot result
Stage 6. Actions with owners, dates and dependencies, and a pilot that records what went wrong as well as what worked.

Stage 7. Follow-up. Report what actually happened

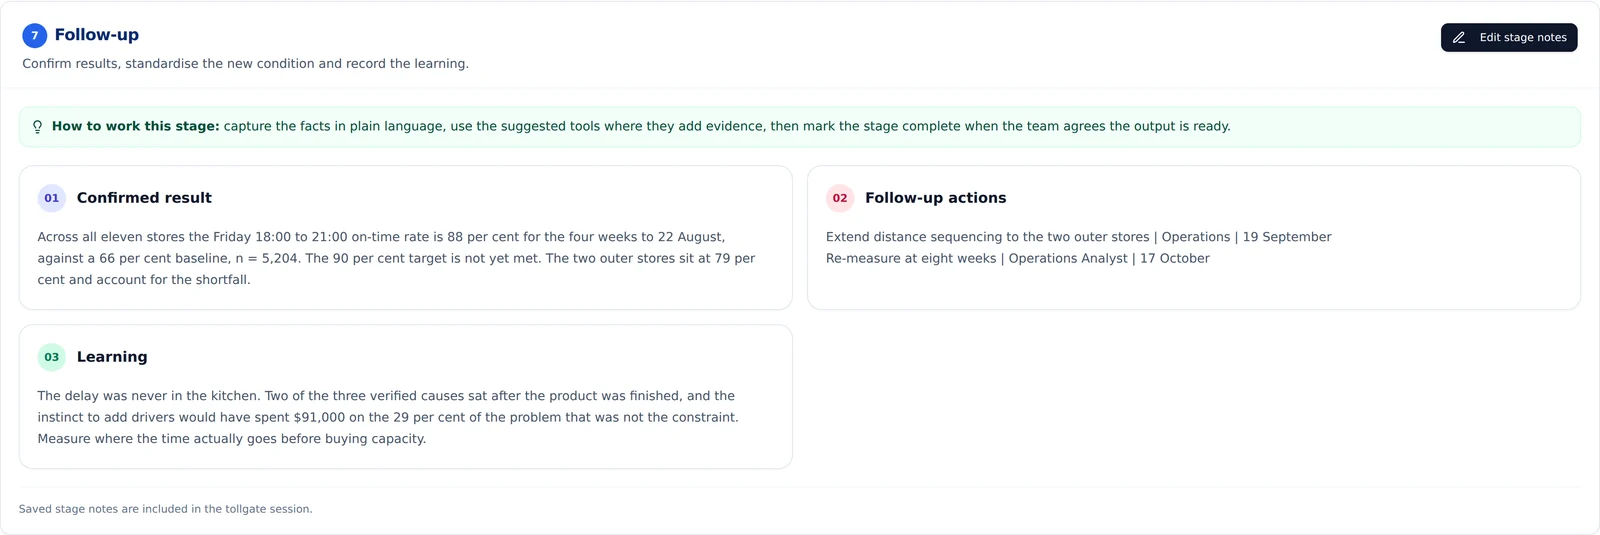
Follow-up confirms the result, sets the remaining actions and records the learning. The temptation is to declare victory. The example does not: 88 per cent against a 90 per cent target, with the two outer stores at 79 per cent named as the shortfall.

That honesty is the difference between an A3 and a status update. A reviewer can see exactly what is left, who owns it and when it will be remeasured. The stage stays open until the number is met or the team decides it will not be.

The learning line is the part that outlives the project. Here it is that the delay was never in the kitchen, and that the instinct to add drivers would have spent $91,000 on the 29 per cent of the problem that was not the constraint. That sentence is reusable across every other store network in the business, which is more value than the countermeasures themselves.

The A3 Follow-up stage reporting 88 per cent against a 90 per cent target, with remaining actions and the learning
Stage 7. The target was not met, and the A3 says so, names the two stores responsible and gives the remeasure date.

What A3 will not do for you

A3 is a thinking discipline, not a statistical one. It will not tell you whether a difference is significant, whether your measurement system is capable, or whether an observed shift is signal or noise. If those questions decide your outcome, you need the Measure and Analyse tools behind the page, and possibly a full RDMAICS project instead.

It will not make an unverified cause safe either. The format asks for evidence beside each cause, but nothing stops a team writing a plausible sentence and moving on. The check is social: someone has to read the evidence line and ask whether it could have come out the other way.

And it will not survive being written at the end. An A3 filled in after the work is finished is a report. An A3 filled in as the work happens is a method, because the stages force the argument to hold together before the next one starts.

  • Seven stages, one page, every claim carrying its evidence
  • Verify causes before choosing countermeasures, and record what you rejected
  • Report the result you got, not the result you wanted
A3 problem solvingA3 report templateA3 worked examplecurrent conditionroot cause verificationLean problem solvingPDCA

Run this method inside Ci Flow

RDMAICS, A3, Just Do It and Kaizen projects with the full Lean Six Sigma toolset, AI interpretation and tollgate presentations built from your real evidence.

Keep reading

Ci Flow

Ci Flow connects improvement methodologies, guided tools, project evidence, AI support, collaboration and tollgate presentations in one operational-excellence workspace.

RDMAICS · A3 · Just Do It · Kaizen

© 2026 Ci Flow. All rights reserved.

Built for evidence-led continuous improvement